A service website can show thousands of Search Console impressions and almost no clicks. When most of its queries rank below position 50, that pattern is expected. This article reads one real property at that depth, explains what the numbers count, and sets out what to fix first.
The answer first: nearly all of the impressions sit out of reach
The data comes from seoindia.co, which is SEOIndia’s own website. We read its Search Console property (web search type, final data) from a pull generated on 23 October 2026. In the 28 days from 24 September to 21 October 2026, seoindia.co recorded 12,903 impressions, 5 clicks and an average position of 72.34. Over 90 days, from 24 July to 21 October 2026, it recorded 75,014 impressions, 21 clicks and an average position of 77.72.
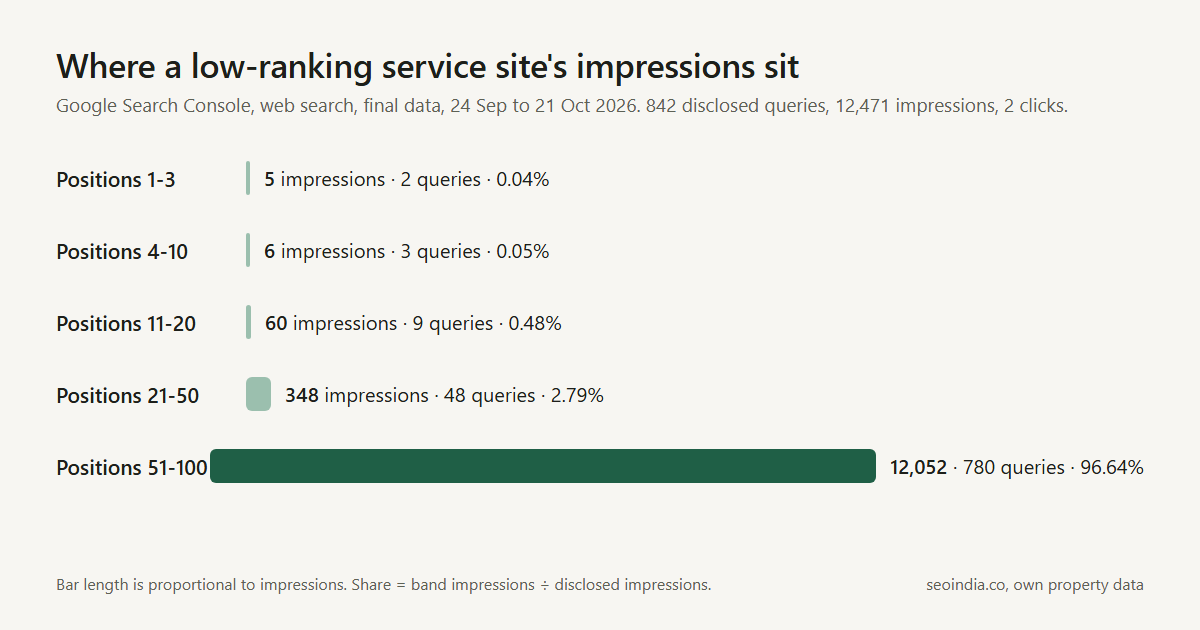
That is the classic picture of impressions but no clicks. Of 842 disclosed queries in those 28 days to 21 October 2026, 780 averaged position 51 or worse and carried 12,052 of 12,471 query-level impressions (96.6 percent). We placed each query in a band by its own average position.
| Average-position band | Queries | Impressions | Share of disclosed impressions | Clicks on listed queries |
|---|---|---|---|---|
| 1 to 3 | 2 | 5 | 0.04% | 0 |
| 4 to 10 | 3 | 6 | 0.05% | 0 |
| 11 to 20 | 9 | 60 | 0.48% | 1 |
| 21 to 50 | 48 | 348 | 2.79% | 0 |
| 51 to 100 | 780 | 12,052 | 96.64% | 1 |
| Total | 842 | 12,471 | 100% | 2 |
Very few searchers venture that deep. A Backlinko study of Search Console data, last updated on 16 April 2025, found that “only .63% of Google searchers clicked on something from the second page”. Its data is older than that update and its country mix is not stated, so we use the figure only as an order-of-magnitude indicator. A query that averages position 51 or worse sits far beyond the second page.
At that depth, a near-zero click count is the normal result. The useful question is how many queries sit near enough to the top for a click to be plausible.
What an impression and an average position actually count
Google counts an impression when “a user has seen (or potentially seen) a link to your site”, according to Google Search Console Help. The same page sets the rule that matters most at depth: “A link must get an impression for its position to be recorded.”
In its example, if your result sits on page 3 and the searcher views only page 1, “its position is not recorded for that query”. On a classic results page, a recorded position far down the list means a page at that depth was loaded at least once for that query.
What the rule implies for deep positions
Read a position between 50 and 100 as a record of exposure. On a classic results page, it shows that the page was loaded. It does not prove that a person read the listing or had a fair chance to click it, and the definition is silent on who or what loaded the page. It says little about demand you could win from the current ranking.
Average position has its own rule. The Performance report overview defines it plainly: “Average position: The average position of the topmost result from your site”. Only your highest listing for each query counts, so a second URL further down stays invisible here. And the figure is averaged across all the queries where your site appeared, so it blends near-top queries with deep ones. Read impressions by band, and average position query by query.
Fourteen queries in range: reading the distribution
The other end of the distribution matters more for action, because it holds the only queries where a changed title could be noticed. In the 28 days from 24 September to 21 October 2026, only 14 queries averaged position 20 or better. Together they carried 71 impressions (0.6 percent of the query-level total). Seven of them were Dubai queries (43 impressions) and one was the brand name. Before testing anything on in-range queries, confirm they are ones the business wants to win. In the same window, 276 of the 842 listed queries recorded a single impression, which gives a position but no pattern to act on.
The previous 28 days, 27 August to 23 September 2026, had 1,069 disclosed queries and 25,639 query-level impressions. The deep band held 1,040 of those queries and 25,252 impressions (98.5 percent), against 96.6 percent in the later window. Between the two windows, queries at position 20 or better rose from 5 to 14, and their impressions from 23 to 71. Both moves are modest, and the data does not explain either.
Each band rests on an average. As a hypothetical illustration, a query averaging 55 may have appeared anywhere from position 30 to 90 during the window, so expect some queries to change band between windows.
Every query worse than position 20 needs its eligibility, page ownership and substance checked first. To sort your own data, check your own positions and place each query in a band before reading any click-through rate.
When impressions halve and average position rises, clicks stay flat
In the 28 days from 27 August to 23 September 2026, seoindia.co recorded 26,578 impressions, 6 clicks and an average position of 78.52. Between that window and the 28 days that followed, impressions fell 51.5 percent, average position improved by 6.2 positions and clicks moved from 6 to 5. Average position rose and impressions halved, yet clicks barely changed.
The weekly view tells the same story. Across 15 full weeks from 6 July 2026 to 18 October 2026, weekly impressions ranged from 1,135 to 10,081 while weekly clicks stayed between 0 and 4.
A year earlier, in the 28 days from 25 September to 22 October 2025, the property recorded 1,414 impressions and 2 clicks. Impressions have grown since then, while clicks have stayed small.
Some of this movement may originate outside the site. Google’s guide to debugging search traffic drops reminds site owners that “positions aren’t static or fixed in place”. Average position also shifts with the query mix: losing a block of queries near position 90 lifts the average even if no page improves.
Writing in September 2025, JumpFly discussed a steep fall in impressions and noted that “ranking trackers like Semrush used num=100 to quickly pull data”. The same article says it has no proof the drop was bot traffic, and that episode came a year before our windows. We have not established what drove our own swings.
A handful of clicks is too few to read as a trend, so treat any swing in impressions or average position as a cue to check which queries moved. When you structure SEO reporting, pair every impressions figure with clicks, the window and its band.
The clicks the query table cannot see
At this depth, the query table that most people open first hides most of the clicks. In the 28 days from 24 September to 21 October 2026, the query table attributed 2 of the 5 clicks on seoindia.co to a listed query; the other 3 sat in anonymised queries. Over the 90 days from 24 July to 21 October 2026, the figures were 7 of 21.
Google’s Search Console documentation explains that the Performance report holds back some data to protect user privacy, and that “anonymized (rare) results are omitted from the table, but are included in the chart totals”. The chart total is the property figure; the table is a subset.
Impressions reveal the same gap on a smaller scale. In the same window, the query table accounted for 12,471 of the 12,903 impressions (96.7 percent). So the listed queries describe nearly all of the impressions and under half of the clicks.
The page table has the opposite problem. In the same window it summed to 16,009 impressions, 124 percent of the property total, because page rows are aggregated by page. Google’s overview of the report explains that the chart is aggregated by property, so two results from one site for one query count once there. In the page table, each URL can record its own impression, so summed page rows can count one search more than once.
Three reading rules follow:
- When you quote a total, take it from the property chart. It includes the anonymised queries and does not double count across pages. For impressions at this depth, report by band, as the reporting table below sets out.
- Never add up page rows. Compare pages with each other, and treat their sum as an overcount.
- Treat query-level clicks as a partial sample. When most clicks sit in anonymised queries, the listed ones cannot show which searches bring visitors.
The position bands above rest on listed queries that hold 96.7 percent of impressions in the 28 days to 21 October 2026, so they stand. Click attribution is what needs caution.
Human or automated impressions: what is known and what is not
Whether people produced numbers this deep is a fair question. Google’s documentation settles part of it, and the rest is open.
Google’s guidance on AI features says “There are no additional requirements to appear in AI Overviews or AI Mode”. It also says these features are reported within the Web search type (Google Search Central), the search type used for every figure here. Google’s definitions page adds that “Position in AI Mode follows the same methodology as a Google Search results page”. So AI Mode appearances share the totals and position rule of classic results.
Neither page says how many impressions come from automated retrieval. One independent write-up on freeCodeCamp argues that AI Mode and AI Overviews expand a prompt into narrower sub-queries. In its words, “Each of those sub-queries is a real search against the real index.” The author concludes that a page retrieved for a sub-query logs an impression, a single writer’s hypothesis that Google has not confirmed and we treat as unproven.
Our own data adds one clue. In the 28 days from 24 September to 21 October 2026, 84.4 percent of the impressions for seoindia.co (10,891 of 12,903) came from desktop. That pattern is consistent with, not proof of, machine-driven searching. A business audience working from office computers could produce a similar split, and this report cannot separate the two.
In practice, the answer matters little: none of the triage steps below depends on who produced the impressions. To see how your pages surface inside AI features, an AI search diagnosis looks at that directly.
A triage ladder for a site that ranks below page 5
At this depth, effort on a later rung is wasted while an earlier one fails, so we work through five rungs in order.
- Eligibility. Check that each target URL is indexed and eligible to appear. Use URL Inspection, then confirm the canonical, any noindex tag and the robots rules. Nothing else matters until this passes. A site audit tool and our technical SEO checklist for business websites cover the usual blockers.
- Position band. Sort every query into three bands: 1 to 20, 21 to 50 and 51 to 100. Use each query’s own average position and note the window beside the band.
- Intent and ownership. Decide which one page should own each query, then check whether two of your URLs split it. On seoindia.co, in the 90 days from 24 July to 21 October 2026, “seo services india” drew 3,747 impressions at an average position of 80.3. The homepage recorded 3,497 page-level impressions for it and the services page 1,597, so two of our own URLs split one query. Page rows are aggregated by page, so the two figures overlap.
- Substance and links. Compare the owner page with the pages that outrank it, and note what it lacks in coverage, evidence and links. This is where a one-time SEO audit is useful, because the gaps differ page by page.
- Snippet and title tests. Test titles and descriptions only for queries at position 20 or better with enough impressions to read. On seoindia.co, from 24 September to 21 October 2026, that pool was the 14 queries and 71 impressions counted earlier. That is too little data to read any test.
We do not rewrite titles for queries worse than position 20. At that depth a better snippet reaches very few searchers.
Read against this ladder, seoindia.co’s own data from 24 September to 21 October 2026 points to rungs 2 and 3. In that window, 780 of 842 queries sat at 51 or worse, and over the 90 days to 21 October 2026 a head query, “seo services india”, was split between two of our URLs. Rung 5 cannot be used, because the title-test pool is the 14 queries counted above.
What to report to a client or board instead of impressions
The impression total moves with the query mix and, as shown above, can halve while clicks hold steady. The numbers below hold up better, provided each one carries its window and a note on what it cannot show. As the report overview sets out, average position counts only your topmost result for each query, and page rows are aggregated by page.
| Metric | Use | Caveat |
|---|---|---|
| Property-level clicks and conversions | The closest link to business value. Pair clicks with the enquiries your analytics captures. | Search Console holds no conversion data. Small click counts swing on a handful of searches. |
| Count of queries by band over time | Shows whether queries move from 51-100 toward 21-50 and 1-20. | A band reflects an average, so the query may have appeared well above or below it. |
| Count of queries in the top 20 | Marks the pool where title and snippet tests become feasible. | A small pool cannot support a click-through test. Show its impressions next to the count. |
| Indexed-page count | Confirms the pages you want ranked are eligible at all. | An indexed page can still rank nowhere. Check that each indexed URL is the one meant to own its query. |
| Branded versus unbranded clicks | Separates people who already know the name from fresh demand. | Brand filters are set by hand and miss misspellings. At low volume the split is erratic. |
| Impressions by band | Shows where impressions sit, one band at a time. | Report the bands side by side and leave out the single total, which the deepest band dominates. |
Agree these metrics, windows and caveats before work begins. The same pairing belongs in the plan for the first 90 days of an SEO engagement.
What this one property cannot tell you
Everything in this article comes from one property, seoindia.co, for windows that end on 21 October 2026, which is a narrow base. Treat the method as repeatable on your own property, and the figures as valid for this site in these windows only.
The limits we know about
- One property. A single service site cannot show what is typical. Sites with different competitors or history may look quite unlike it.
- Anonymised queries are missing. Even in final data, rare queries are left out of the query table, so some clicks have no query attached.
- Bands use averages. A band label can hide a wide spread of actual positions.
- The page table double counts. One search can register against several of our URLs, so page sums cannot be set against the property total.
- No outside check on the impression mix. No external data indicates how many impressions came from people, tools or AI features.
- The windows will age. Rankings shift after any window closes, as Google’s guide to debugging search traffic drops notes. A fresh pull may alter the picture.
The order of work carries over to any site. If your own Search Console looks like this one, a free audit with a 90-day roadmap can apply the same reading to your property and set out which fixes come first.
Frequently asked questions
Why does Search Console show impressions when nobody clicks?
Search Console counts an impression when a user has seen, or potentially seen, a link to your site. A result on a results page the searcher never loads records no position for that query. At deep positions most impressions are links that few people could reach. A near-zero click count there is the normal result, and on its own it does not point to a fault.
Should I rewrite titles and descriptions when impressions are high and clicks are zero?
Only for queries at roughly position 20 or better with enough impressions to read a result. On seoindia.co, in the 28 days from 24 September to 21 October 2026, that was 14 of 842 queries and 71 impressions, too few to test. Below that range, work on eligibility, page ownership and substance first.
What should a service business report instead of impressions?
Report property-level clicks and conversions, the number of queries in each position band, the number in the top 20, indexed pages, and branded versus unbranded clicks. State the window for each figure. Add a short note on what each number cannot show, such as clicks hidden in anonymised queries or a sample too small to read.
Can I trust average position?
Use it with care. It is your site’s topmost position for each query, averaged across all the queries where it appeared, so it blends very different queries and moves when the query mix moves. From the 28 days ending 23 September to the 28 days ending 21 October 2026, this property’s position improved by 6.2 while impressions fell 51.5 percent. Read it by band.